Predictions
Atlas Analytics’ predictions are our track record to validate why you should follow our forecasts and subscribe to our Client Portal.
For Atlas Analytics, the proof is in the pudding…
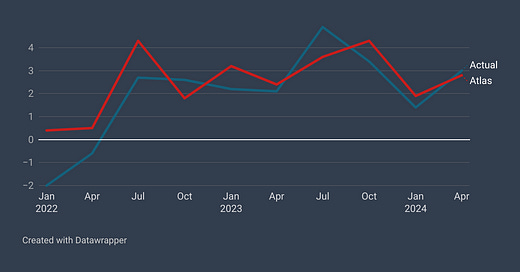
Above is a chart comparing our prediction results to the actual GDP values released by the Bureau of Economic Analysis (BEA). Hover over the graph to see our values compared to the official government releases.
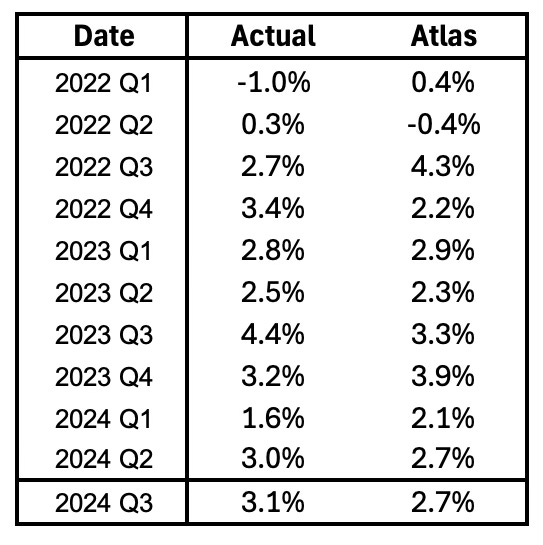
Below is the data in tabular form:
Source: Atlas Analytics, FRED, BEA
Comparing the absolute values of the deviations between the Actual and Atlas Analytics values yields an average error rate of approximately 0.6 percentage point. In large part, this discrepancy in accuracy comes from Net Exports (NX), which we will discuss in more detail in a forthcoming blog post.
It should be noted that on September 26, 2024, the BEA released a 5-year revision to the official GDP values released between 2019 and 2024 and on January 1, 2025, Atlas Analytics updated our prediction results to reflect these updated GDP values.
Atlas Analytics’ Prediction Accuracy
How accurate are Atlas Analytics’ methodology and predictions?
Regarding the methodology, our team has conducted numerous tests to evaluate the association between the satellite imagery of the built environment and economic activity. Utilizing regressions, we have found that the t-statistic on our satellite variables were nearly 3.5 standard deviations from the mean, suggesting it was very unlikely (less than 1 in 1000) that this was a false positive. Even more promisingly, when we ran a variable importance test on the AI prediction algorithm, of the top 10 most important variables, our satellite imagery data constituted seven, even when including key traditional variables such as inflation and previous GDP.
Want to Trade Atlas Analytics?
Once a month, Atlas Analytics posts our proprietary GDP forecasts and price targets for four macro-exposed ETFs to make you a better-informed trader. Want access, visit our Client Portal page or subscribe below.


