


The US Economy Is Not Heading for a Recession Yet
Current GDP Is Not Weak as the Consensus Would Have You Believe

TLDR:
The U.S. economy is not as weak as financial markets and analysts suggest.
While Q1 GDP may be flat or slightly negative, this is largely due to distortions in GDP components like Net Exports.
By focusing on Core GDP, which excludes volatile factors like Private Inventories and Net Exports, the underlying economic strength appears much more positive.
Atlas Analytics' real-time satellite data shows Core GDP growth around 3.4%, suggesting the markets are oversold.
This may be an opportune time for investors to buy equities or calls as Core GDP offers a clearer view of the economy’s health.
U.S. GDP is not as weak as the financial markets or economic pundits would have you believe.
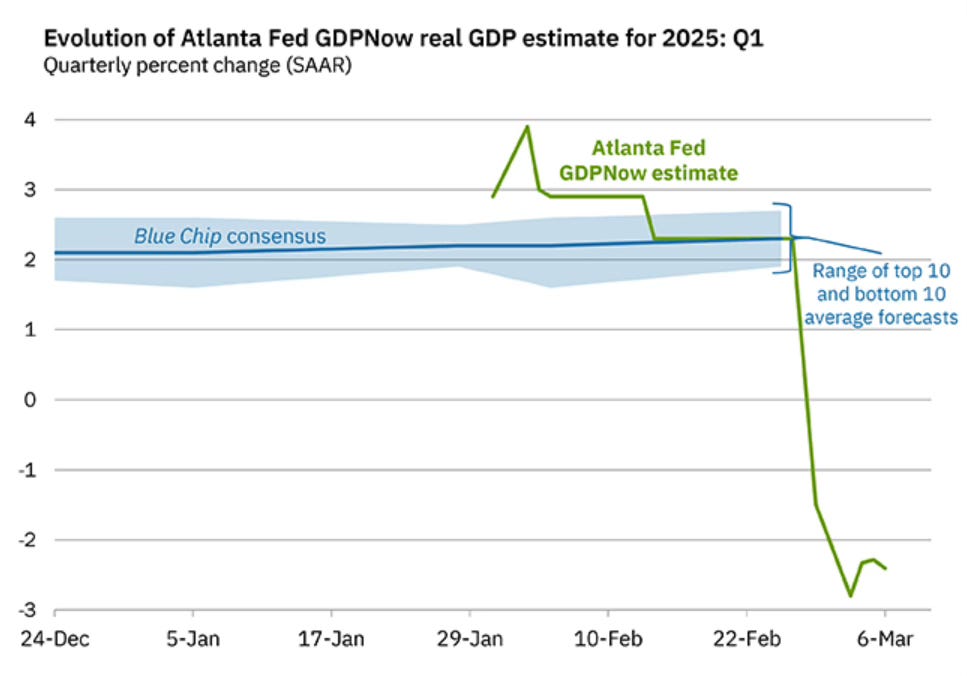
Yes, GDP will likely be flat or slightly negative for Q1 2025 when the BEA’s first print is released on April 30. And yes, the financial markets are in correction territory (at least before Friday’s significant rally). But in contrast to the Atlanta Fed’s nowcast that marks the economy at -2.4% as of March 6, this weakness is more an artifact of GDP accounting than an actual indication of economic malaise.
Breaking Down GDP
As I’ve written about previously, GDP is an amalgamation statistic that, in the expenditure approach to GDP accounting, comprises four major categories: Consumption (C), Investment (I), Government Spending (G), and Net Exports (NX). The sum of these four groupings equals GDP.
However, what should we make of overall GDP if the sub-categories diverge in very significant ways, as is happening currently?
Currently, according to the Atlanta Fed GDPNow, Net Exports is subtracting a whopping -3.84 percentage points (pp) from the other GDP categories. If you add this back onto the Atlanta Fed’s -2.4% overall GDP number, one clearly yields a positive value for domestic demand (approximately a GDP growth rate of ~1.4%).
I believe the true number for core U.S. demand is considerably higher than this.
Introducing Core GDP
To make this case, I’m coining the term Core GDP.1
Most economists and financial analysts are familiar with Core GDP’s analog core inflation, which is inflation less volatile food and energy prices. In fact, Core PCE (short for “Personal Consumption Expenditures”) is allegedly the Federal Reserve’s preferred metric for evaluating the effectiveness of monetary policy on price pressure.
Similarly, given the large dispersion in the GDP subcomponents currently, I believe it necessary to consider Core GDP as opposed to just the headline number. For Core GDP, I subtract the volatile Private Inventories and Net Exports categories from overall GDP. The result is Core GDP is definitional Consumption (C), Government Spending (G), and Private Fixed Investment (approximately 30% to 40% of I).
Using econometric regression analysis, Core GDP is a better predictor of stock market valuations than GDP on-the-level, but I will delve more fully into this in a subsequent post coming out at the end of the month (stay tuned!).
Utilizing the Landsat satellites that orbit Earth approximately every ~99 minutes, I’ve been tracking Core GDP weekly and have a real-time estimate of domestic U.S. economic activity tracking toward the release of headline GDP by the BEA at the end of April (DM me if you’d like to be added to a private list that receives this data every Sunday).
Our results are far more stable and less volatile than the Fed’s estimates because Atlas Analytics’ ROY algorithm primarily relies upon satellite imagery updated on regular cadence as opposed to the Atlanta Fed’s nowcast that is updated based upon the syncopated release schedule of various underlying data points.
Why Focus on Core GDP Now?
Here’s the reading as of today (March 16, 2025):
According to ROY, GDP is negligibly positive, and Core GDP is a robust ~3.4%. Of course, this can change, and we’ll continue to monitor the results.
How is Core GDP’s accuracy as compared to the actual?
As evident from the chart above, Atlas Analytics’ Core GDP has an even greater accuracy rate than our GDP numbers (which are averaging an error rate of about 0.6pp).
So Are We Headed for a Recession?
According to the National Bureau of Economic Research (NBER), the organization tasked with officially demarcating U.S. recessions, a recession is defined by “a broad based decline in economic activity.” Colloquially, a recession is defined as two quarters of negative economic growth.
Even though we might have nominally negative GDP growth this quarter largely due to the massive trade imbalance’s impacts on Net Exports, this will not signal an NBER definition of a recession given the core demand is still quite strong.
As such, as of yet, we are not in imminent danger of a recession.

What Does This Mean for Investors?
Some key takeaways:
GDP is not as weak as the financial markets or economic pundits would have you believe, and we are not heading for a recession (yet).
Given the recent dramatic drawdown in the equities markets, Atlas Analytics’ analysis suggests the market is massively oversold (more to come on this in our next Substack article). Now is prime time for buying equities or calls if you have the dry powder.
Core GDP may be a more reliable indicator to follow to assess the economic health of the U.S. economy.
Conclusion
Don’t let misleading GDP headlines or market noise sway your financial decisions. The economy is performing better than it seems, and by focusing on Core GDP, you’ll get a clearer, more accurate view of the underlying economic strength.
To stay ahead of the curve and gain access to our exclusive real-time GDP forecasts, consider subscribing to Atlas Analytics Premium. Visit us at atlasanalytics.com for more information or reach out directly to discuss how we can help optimize your investment approach.
Some astute economic analysts may be familiar with ‘core GDP’ as the sum of Consumption and Private Fixed Investment. Definitionally, I agree but also include Government Spending.
Democrats Smearing Trump For the Biden Economy
https://tinyurl.com/ycy7y4rx