


Irrational Exuberance in the Trump Rally
The SPY is Overvalued and Vulnerable to a Pull-Back

SPY Chart Over the Past ~30 Years

Source: YahooFinance
TLDR:
The SPY is overvalued due to “Irrational Exuberance” brought on by the Trump rally.
Using regressions and Atlas Analytics’ real-time GDP forecasts, we estimate the SPY is susceptible to an approximately ~5.8% pullback.
Consider positioning your portfolio by buying puts, short-selling the SPY, or selling covered-calls to profit off of this market dislocation.
The Trump rally is in full effect, and the SPY (the ETF that tracks the S&P 500) has been on a tear since the U.S. presidential election.
Since November 4, the SPY is up 5.7%. Keep in mind the average annual return for the S&P 500 since 1957 is only 10.3%. Thus, over the last six weeks, the SPY is up more than half of its average annual return.
Of course, a run up in the SPY is welcome if it is commensurate with its fundamental value. But if the appreciation of the equity is greater than its intrinsic value can bear, it is susceptible to becoming overvalued and brittle for a pullback.
Other market valuation indicators are blinking red as well. For instance, the SPY P/E ratio (trailing treasury method) is currently at 30.35, which is 50% higher than its average of approximately ~20 since 2000. In addition, according to our friends at the Kobeissi Letter, the S&P-to-World-GDP ratio is now higher (46.2%) than it was even in the lead up to the Global Financial Crisis (38.8%).
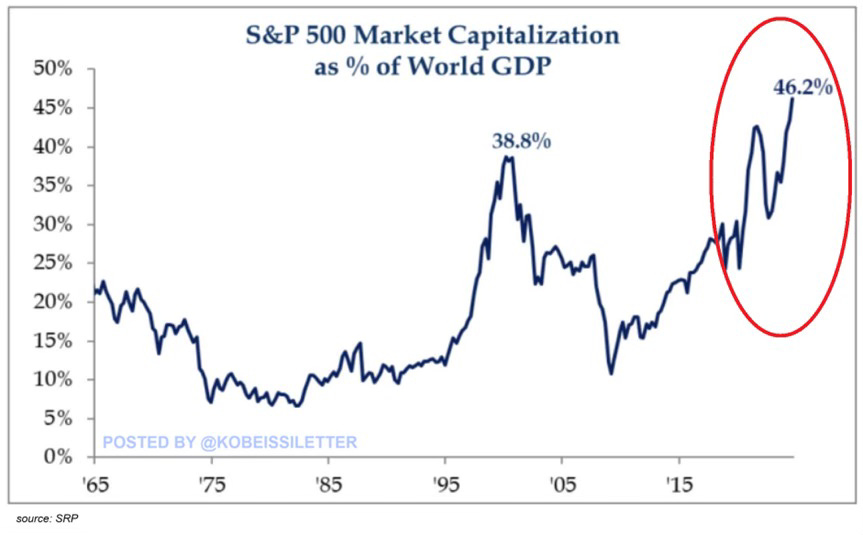
Source: X
As the great former Federal Reserve Chairman Alan Greenspan (my first boss) remarked regarding the late 1990s, this market is experiencing “Irrational Exuberance” as a result of the Trump rally. Today’s market conditions – which are fueled by promises of tax reform, deregulation, and a booming stock market – now risk creating similar irrational enthusiasm. The question now is: Are we sowing the seeds of another speculative bubble?
Atlas Analytics argues, we are.
Keep reading with a 7-day free trial
Subscribe to Atlas Analytics to keep reading this post and get 7 days of free access to the full post archives.