

About Atlas Analytics
GDP Predictions from Satellites

About Atlas Analytics
Satellites circumnavigate Earth every minute of every day. Harnessing the power of these elements constantly taking pictures of Earth’s surface, our team has developed an algorithm that extracts information about the built environment and transforms this into numerical data.
Then comparing this satellite data to past GDP, Atlas Analytics has created an AI and machine learning model to use previous patterns to predict future economic activity. As the satellites continue overhead, we’re able to use remote sensing to model real-time GDP to improve knowledge about the health of the world's economies in real time.
Currently, Atlas Analytics’ model forecasts GDP for the United States. This is extremely valuable information as the U.S. Bureau of Economic Analysis (the official government agency tasked with reporting U.S. GDP) only reports this statistic quarterly with up to a three-month lag. For our next iterations, we plan to expand this technology to other major economies and to regions that don’t explicitly report their GDP data.
How does Atlas Analytics Work?
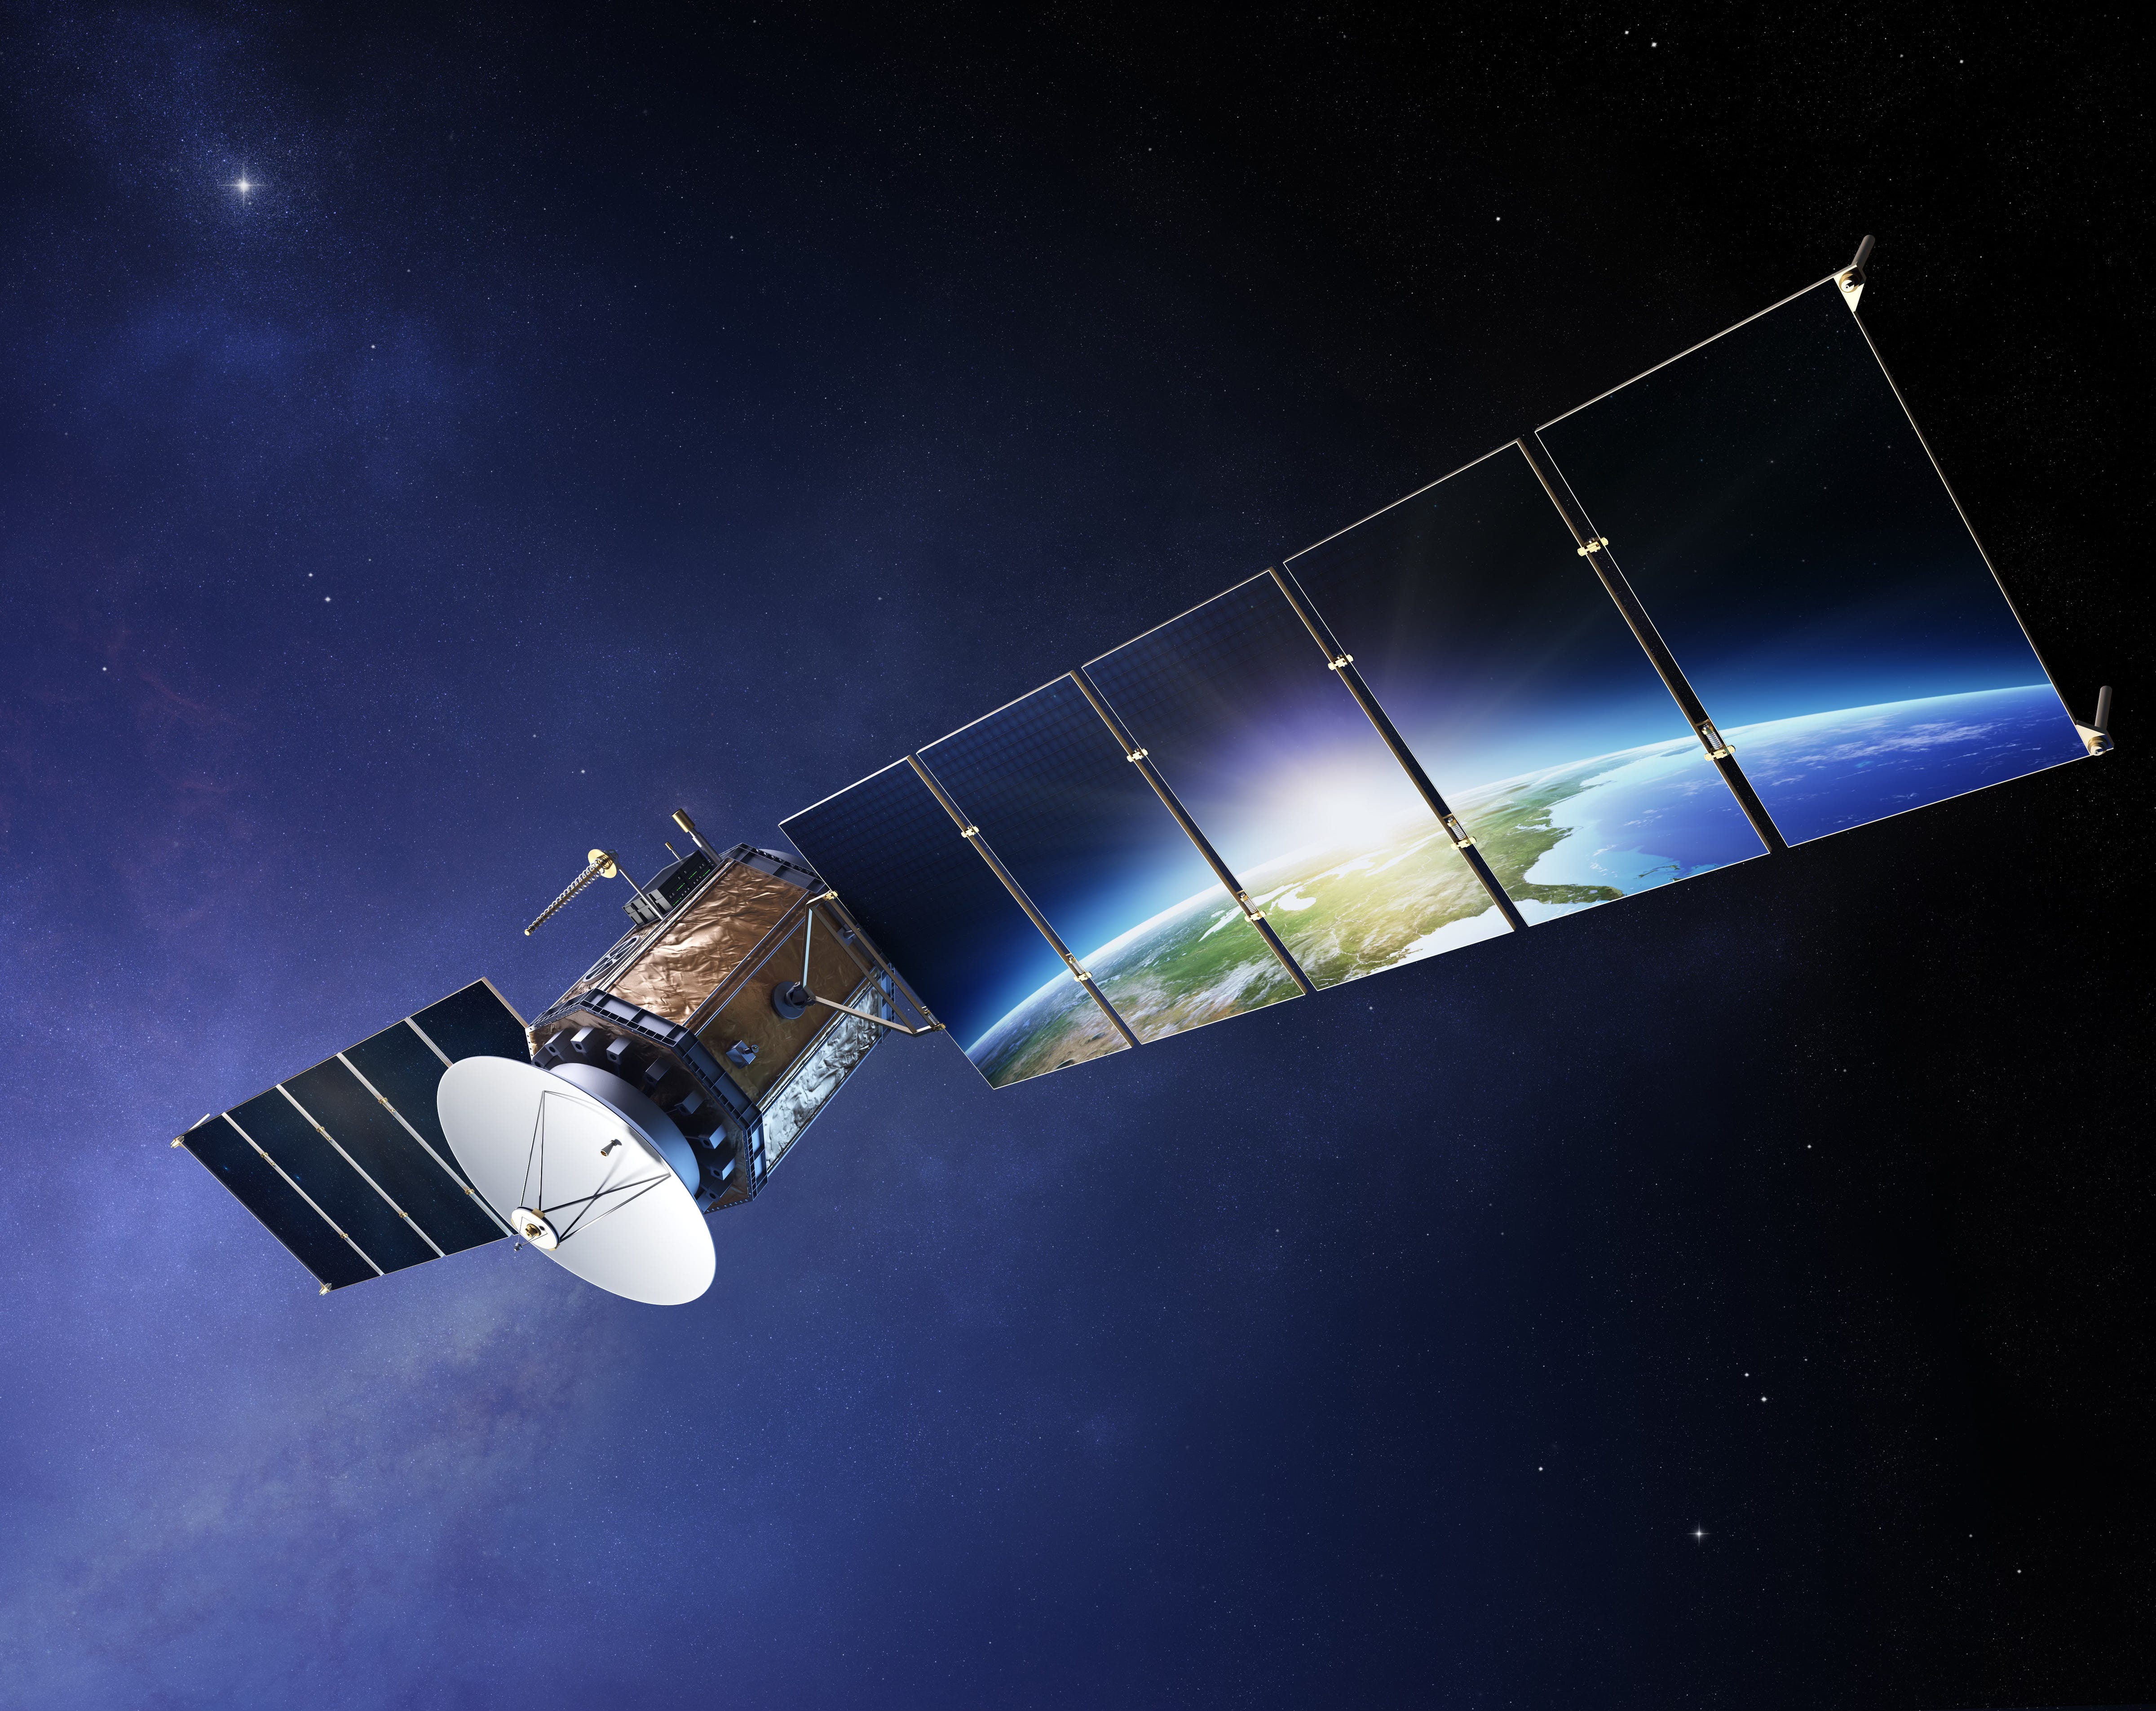
Source: iStock
Atlas Analytics’ ROY (Remote Orbital Yield) algorithm uses a four-step process to predict GDP:
Ingest Satellite Imagery: First, ROY pulls the most recent Landsat satellite images and appends them to the images already in the algorithm’s database. The Landsat Program is a joint venture between NASA and the U.S. Geological Survey (USGS) that has been orbiting satellites around Earth since 1972. Using remote sensing, we then apply a custom algorithm to extract numerical data about the built environment. As the change in the built environment (e.g., construction) is a strong proxy for economic growth, this is our key variable for forecasting GDP.
Pull Traditional Economic Data: Using APIs connected to government data, Atlas Analytics pulls in real-time traditional macroeconomic statistics.
Collate and Clean the Data Pipeline: Combining the numerical satellite imagery with the traditional economic statistics, we move the data through our data pipeline, utilizing feature engineering, imputation, and seasonal adjustment to prepare a final, prediction-ready dataset.
Employ AI and Machine Learning to Predict GDP in Real Time: Finally, we build a statistical learning model relating nearly 40 years of feature data (including, in particular, the satellite imagery) to past GDP growth rates. Utilizing machine learning and AI, we then predict current GDP ahead of government releases.
Atlas Analytics’ Prediction Accuracy
How accurate are Atlas Analytics’ methodology and predictions?
Regarding the methodology, our team has conducted numerous tests to evaluate the association between the satellite imagery of the built environment and economic activity. Utilizing regressions, we have found that the t-statistic on our satellite variables were nearly 3.5 standard deviations from the mean, suggesting it was very unlikely (less than 1 in 1000) this was a false positive. Even more promisingly, when we ran a variable importance test on the AI prediction algorithm, of the top 10 most important variables, our satellite imagery data constituted seven, even when including key traditional variables such as inflation and previous GDP.
Yet, the ultimate test of our predictive capability are the predictions themselves. Above is a chart of our prediction accuracy since Q1 2022, and you can learn more about our accuracy on our Predictions page.
Want to Trade Atlas Analytics?
Once a month, Atlas Analytics posts our proprietary GDP forecasts and price targets for four macro-exposed ETFs to make you a better-informed trader. Visit our Client Portal or subscribe below for access.